Blackbox Explorer Power spectral density charts
The Blackbox Explorers spectrum analyser can show power spectral density (PSD) charts
The power spectral density charts show the noises level in standard dBm/Hz units. For example:
- every 10dBm values difference mean the noise power relation as 10, 20dBm as 100, 30dBm as 1000
- every 20dBm values difference mean the noise amplitude relation as 10, 40dBm as 100, 80dBm as 1000
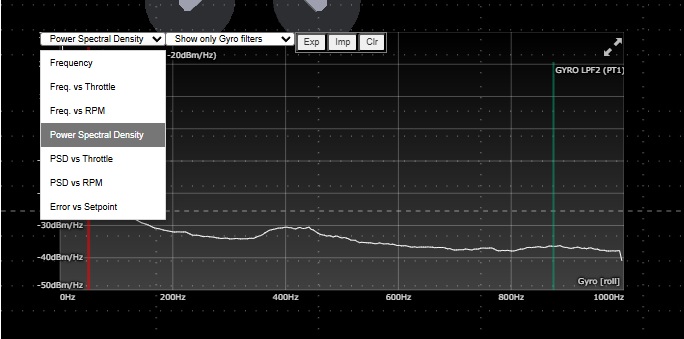
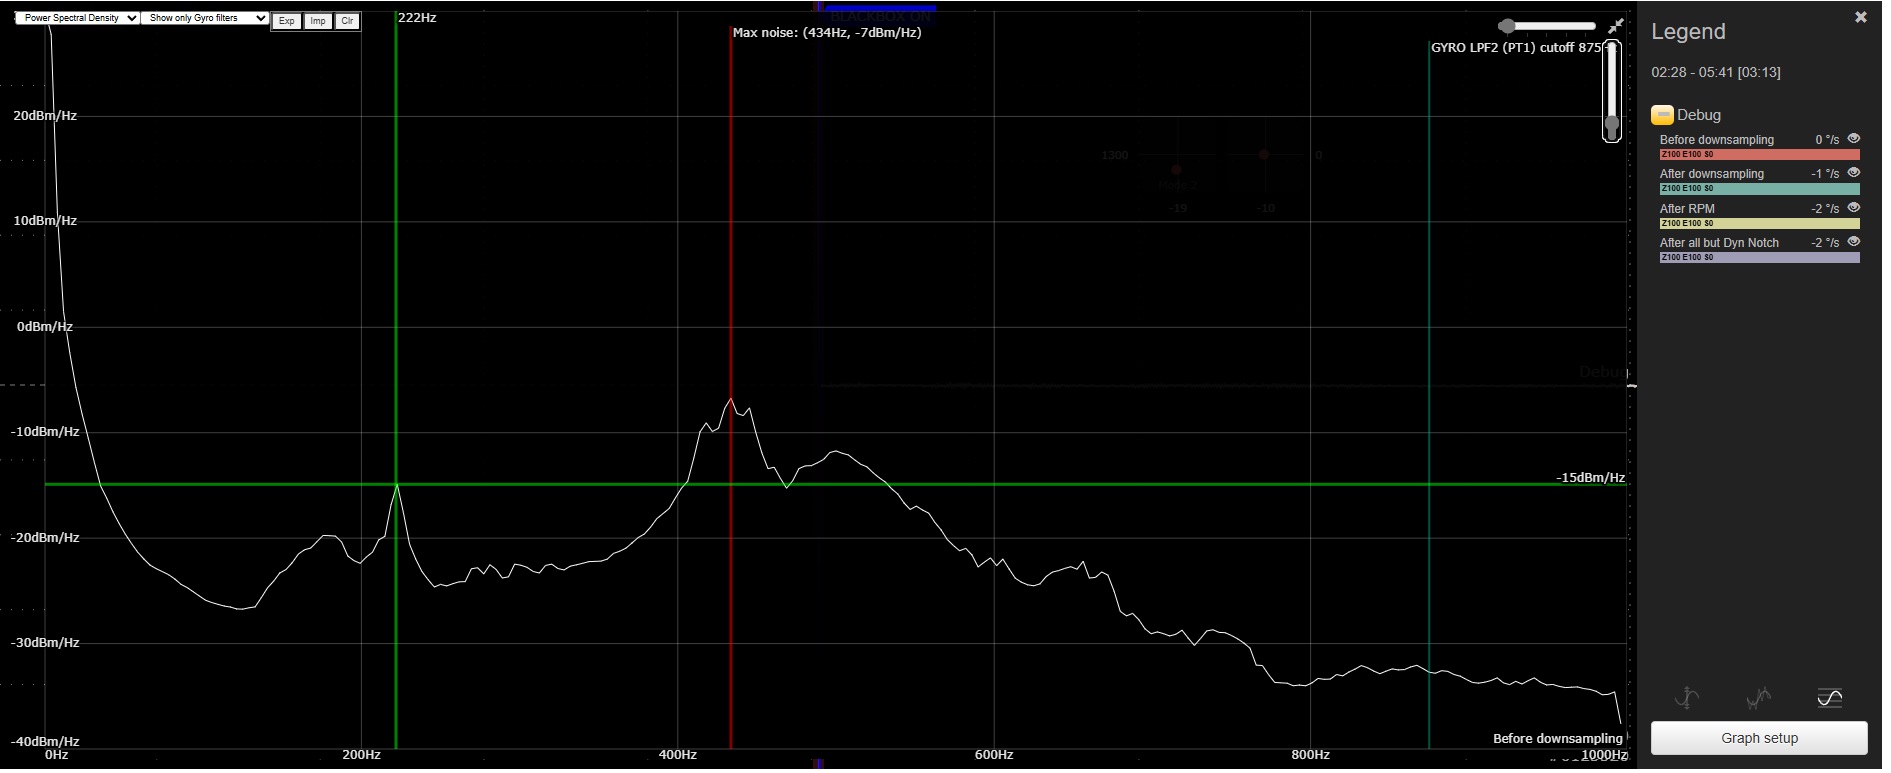
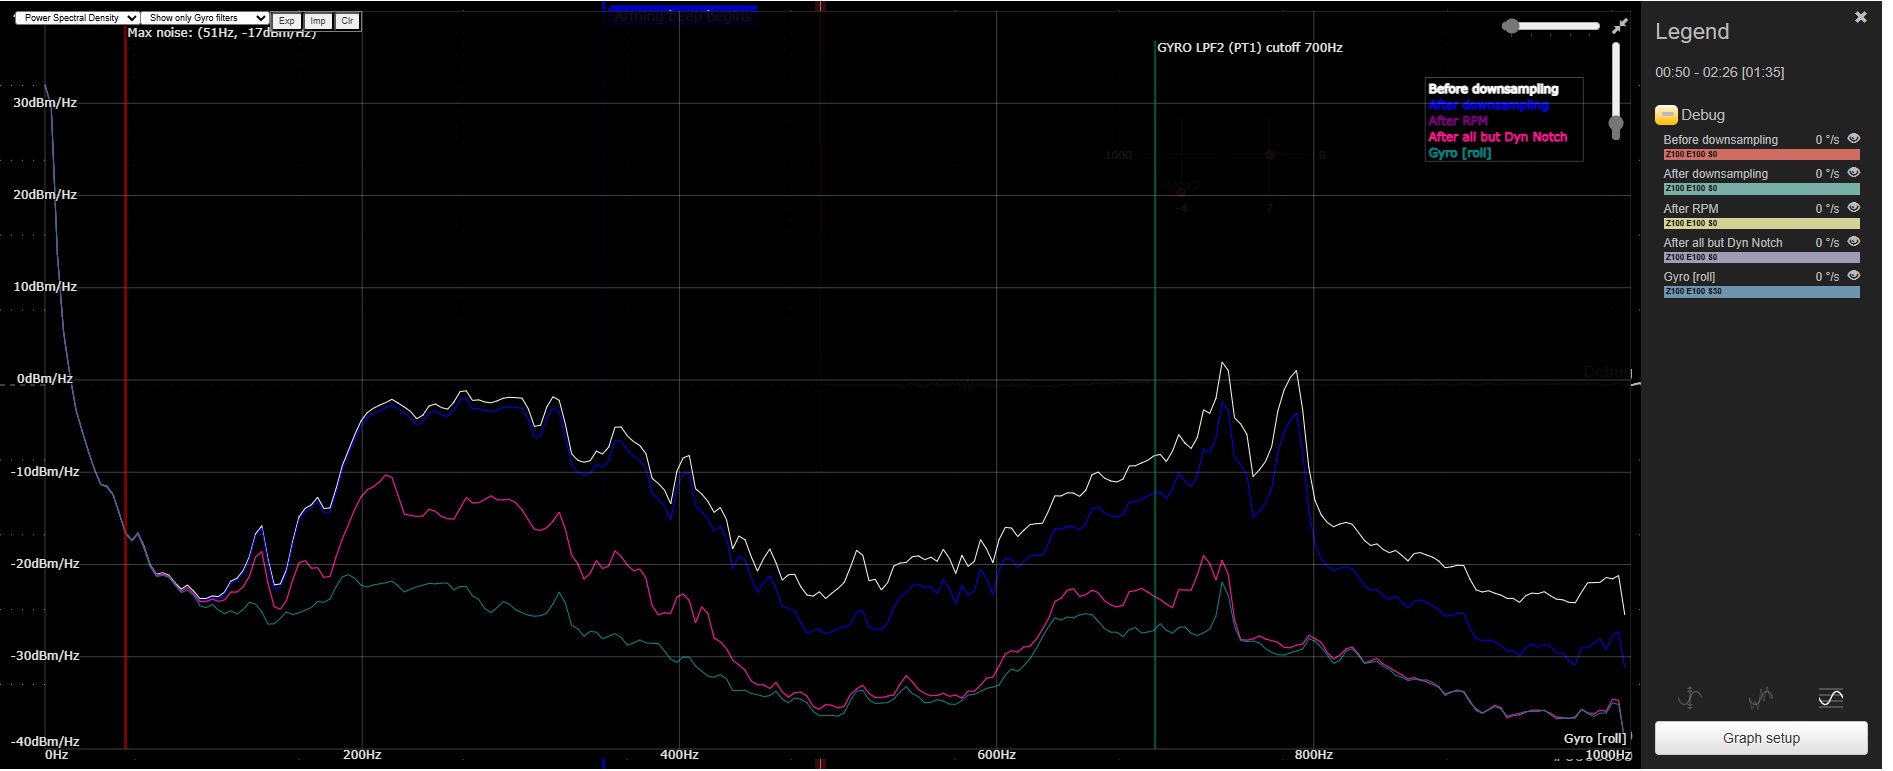
The "Power spectral density" spectrum chart
It shows the noises power spectral density by frequency.
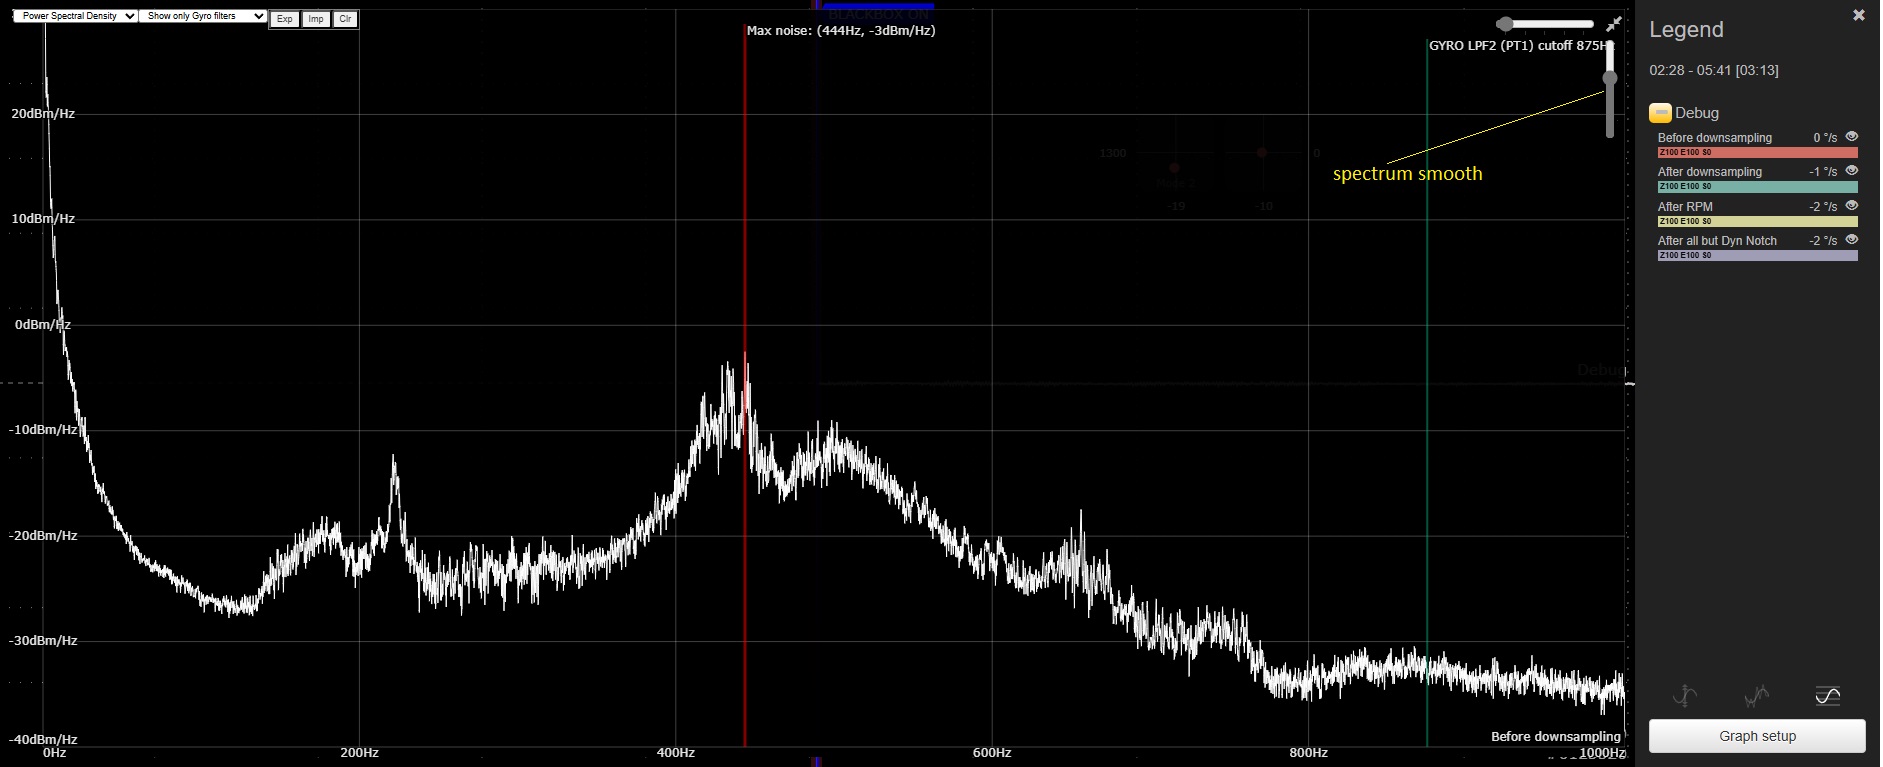
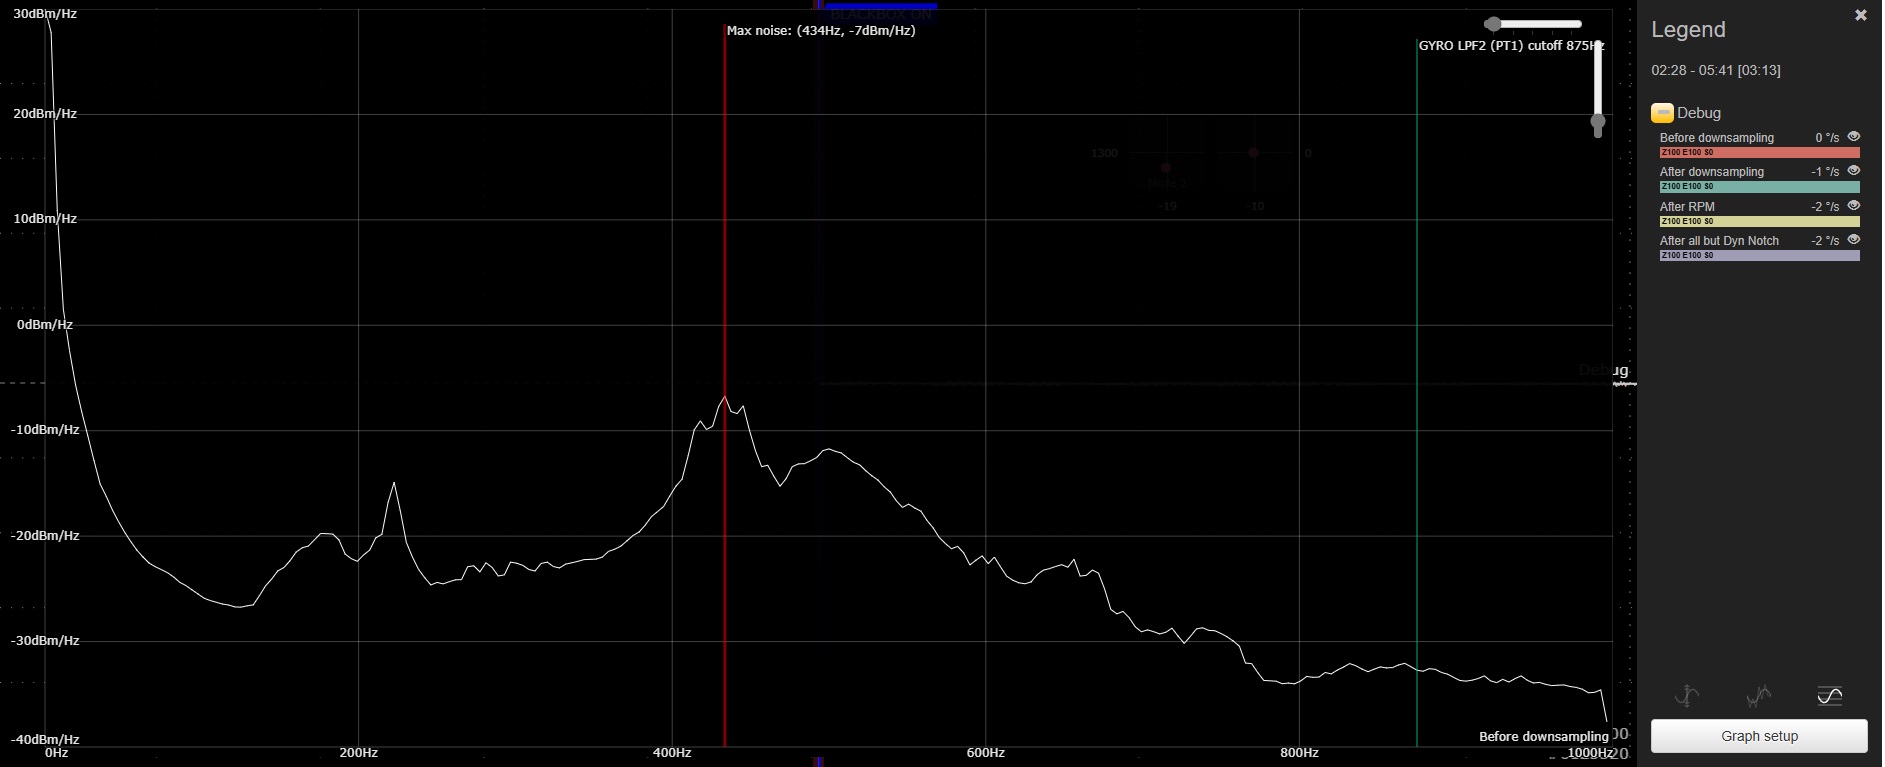 The vertical slider can change curves smooth. The less smooth curve has more frequency resolution.
 The mouse cursor shows current power values by pressing Shift key
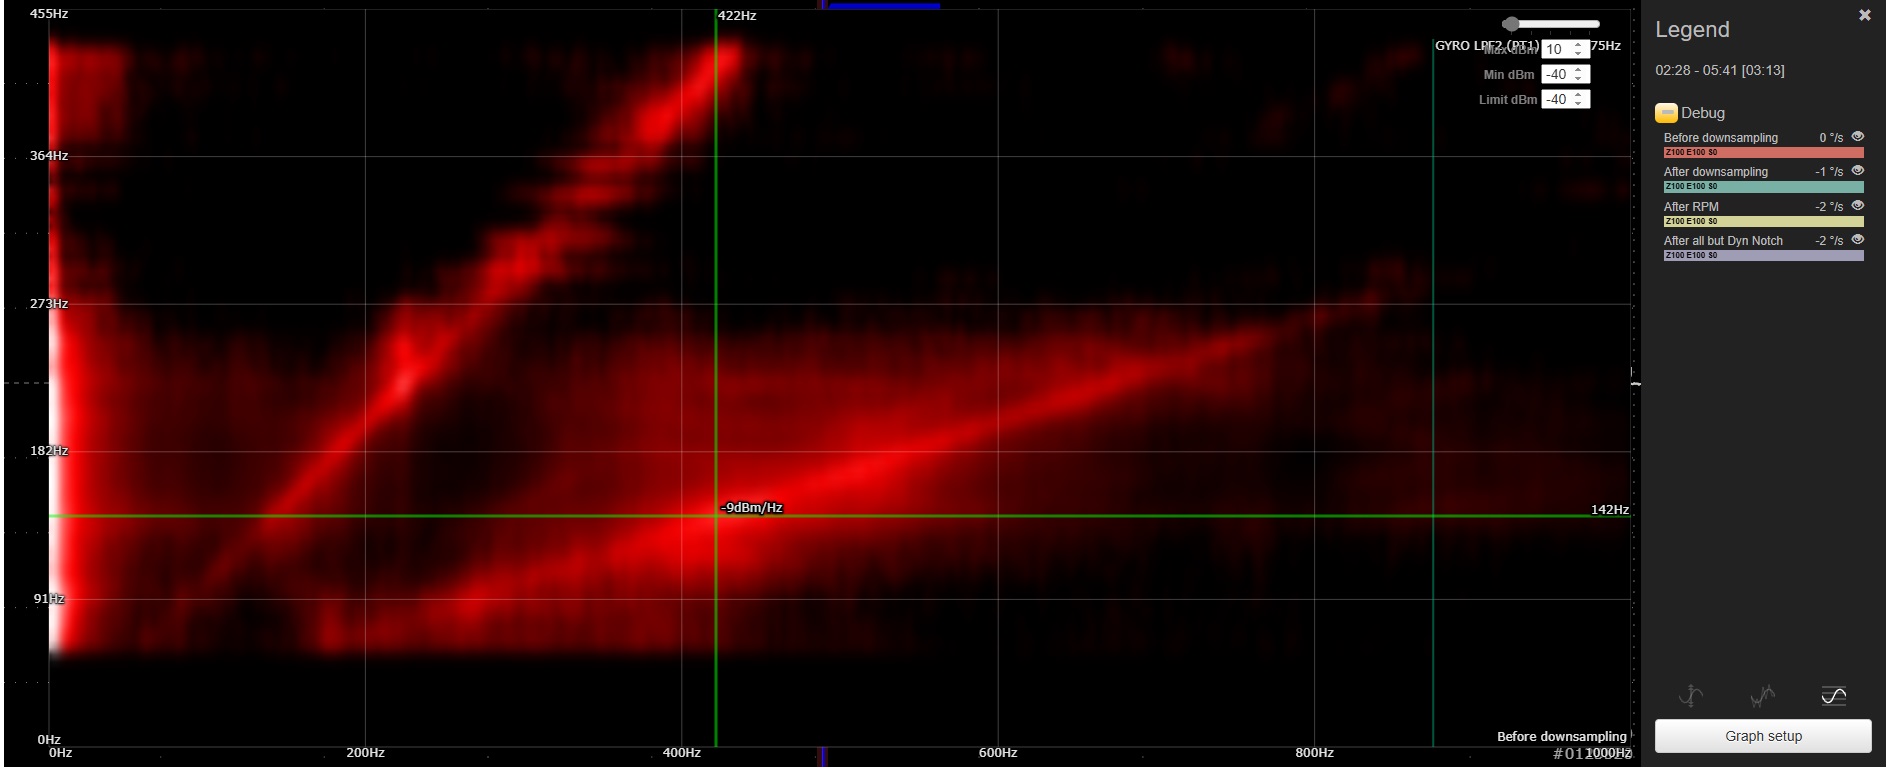
The power spectral density by RPM heat map diagram ("PSD vs RPM")
It shows the noise power spectral density by frequency and RPM.
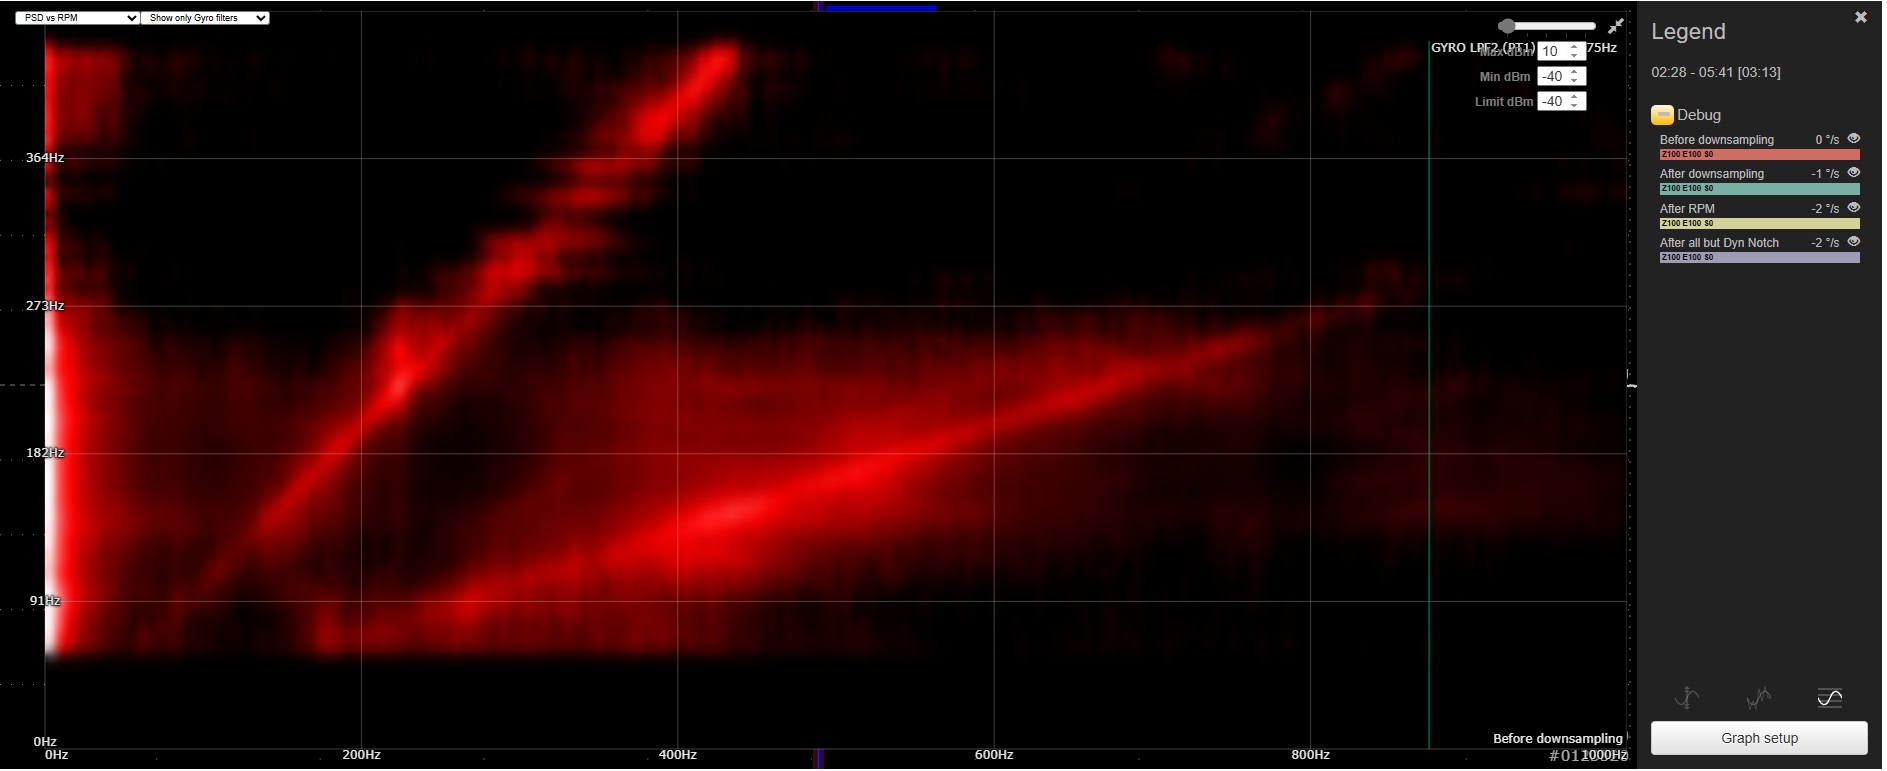 It has the next settings by using the three number input fields in the right-up charts corner:
- "Max dBm" - to set maximum power level what is showed as white color at the chart
- "Min dBm" - to set minimum power level what is showed as black color at the chart
- "Limit dBm" - the power values what are less this limit are showed as black
The mouse cursor shows current power values by pressing Shift key
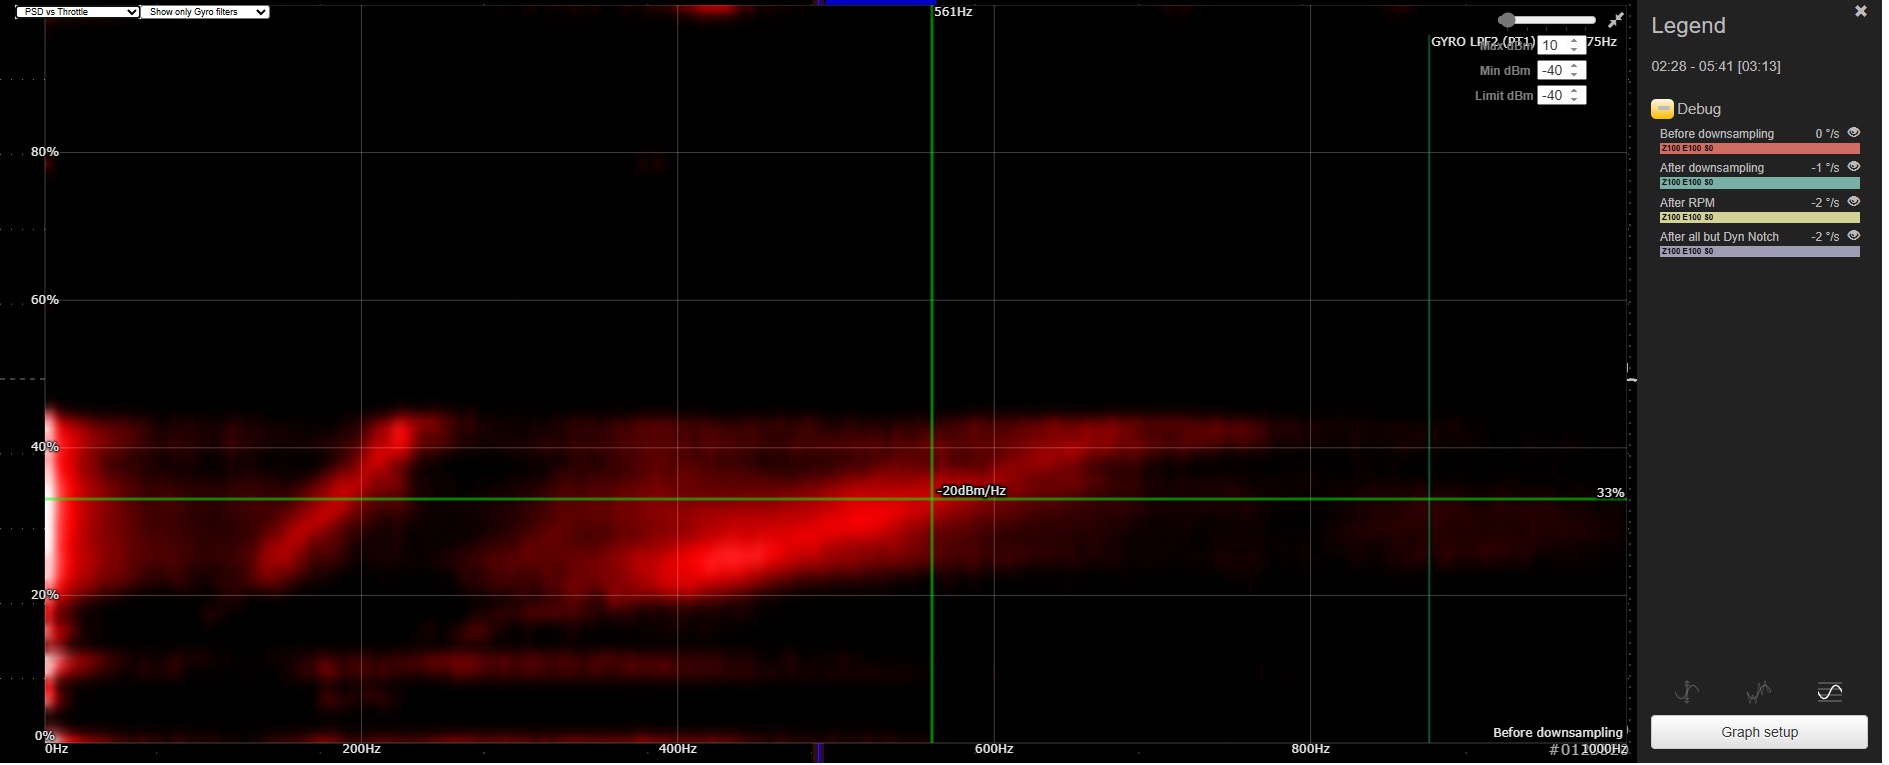
The power spectral density by throttle heat map diagram ("PSD vs Throttle")
It shows the noises power spectral density by frequency and throttle.
It looks like power spectral density by RPM.
But the power spectral density by RPM is more helpfull, when the RPM filter works.
Blackbox Explorer: Power spectral density curves comparison
It possible to compare several spectrums by using of power spectral density spectrum chart. It possible to compare up to 6 spectrums.
To compare PSD spectrums for one log file curves:
- to show "Power spectral density" chart for curve
- to select several curves by Ctrl + Mouse click at the curves legend
- to analyse spectrums difference
- to press "Clr" button to remove the all compared curves
- to repeate Ctr + Mouse click at some curve to remove it from comparison
To compare PSD spectrums for different log file curves:
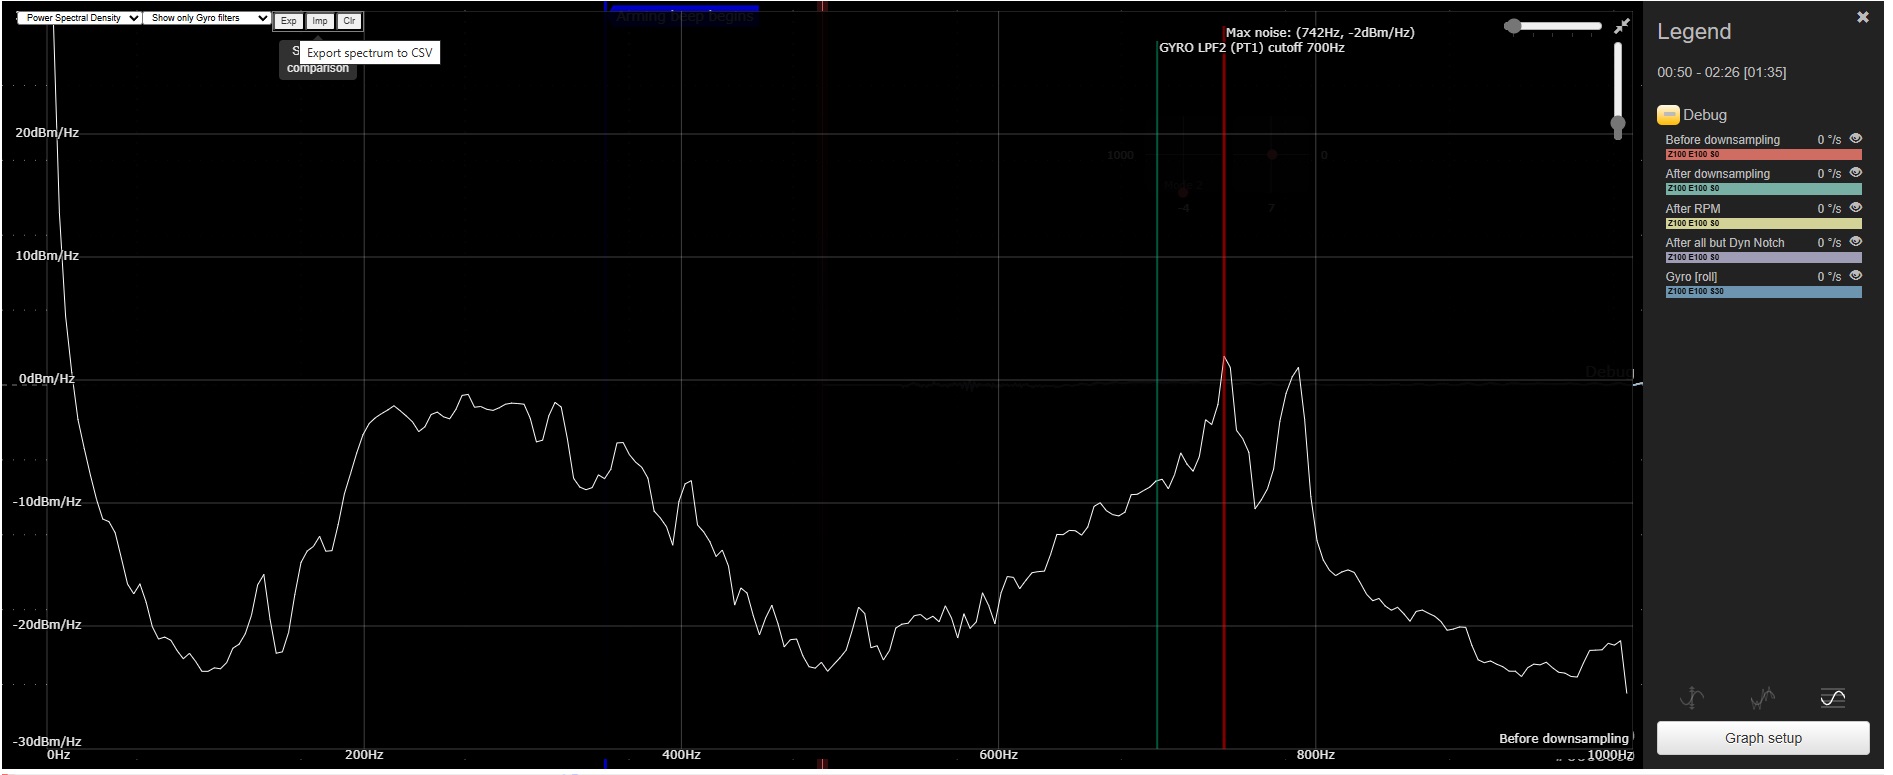
- to show "Power spectral density" for the first log file curve
- to press "Exp" (Export) button. The spectrum data will exported to .CSV file
- to export spectrums from some log files what you need for comparison
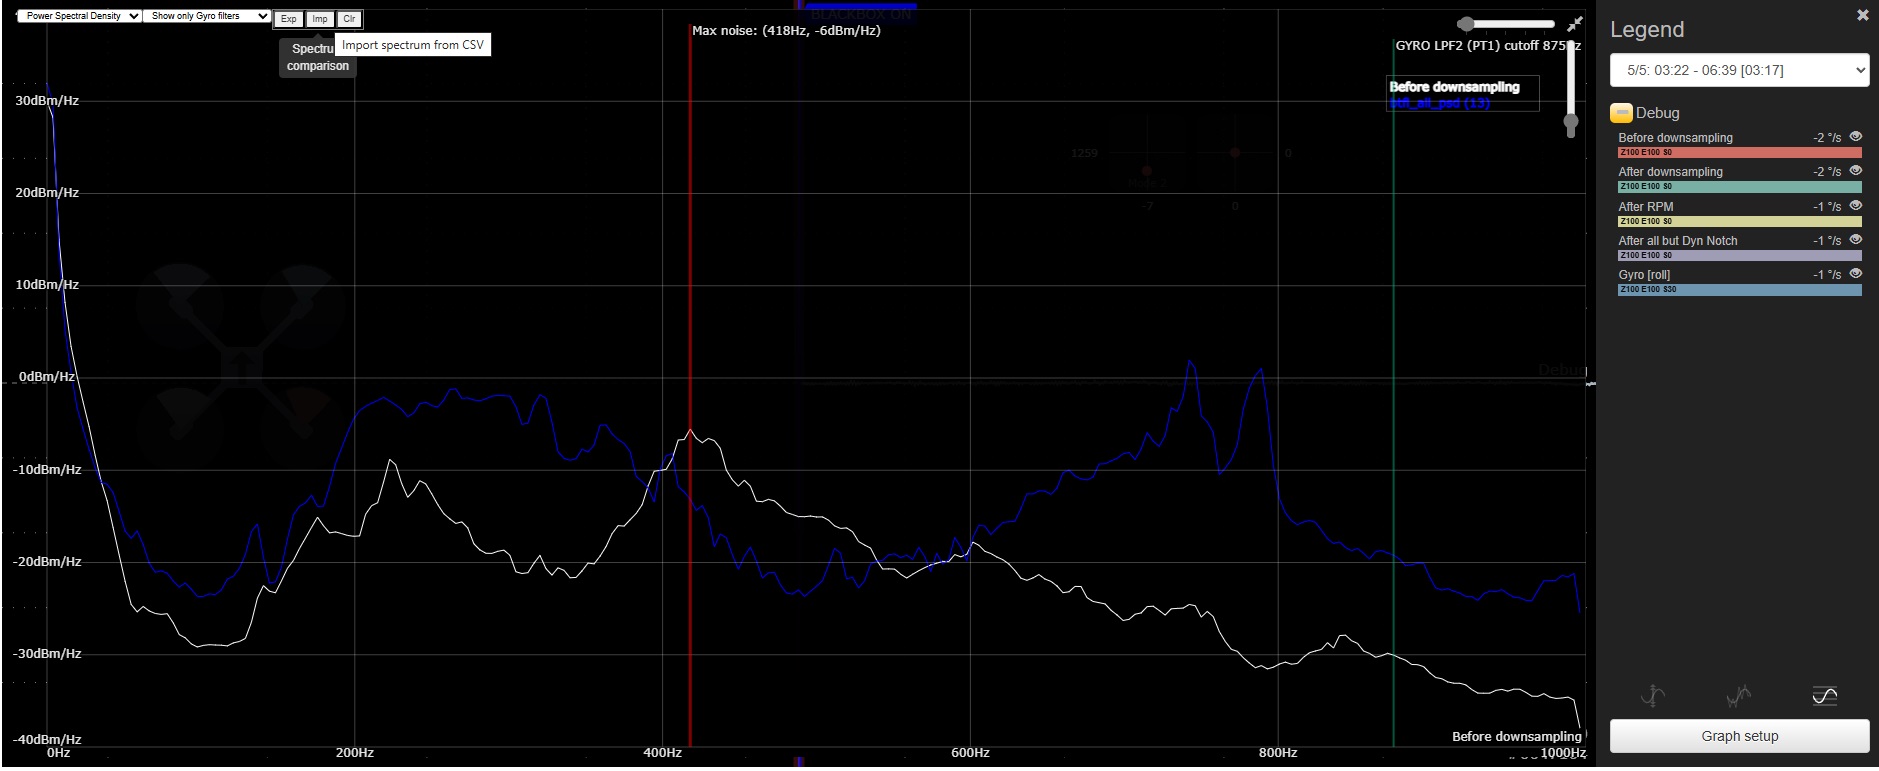
- to show "Power spectral density" to compare some curve with other
- to press "Imp" (Import) button. To select several exported curves log files for comparison by using Open file dialog
- the sepctrums will showed at one chart for analyses
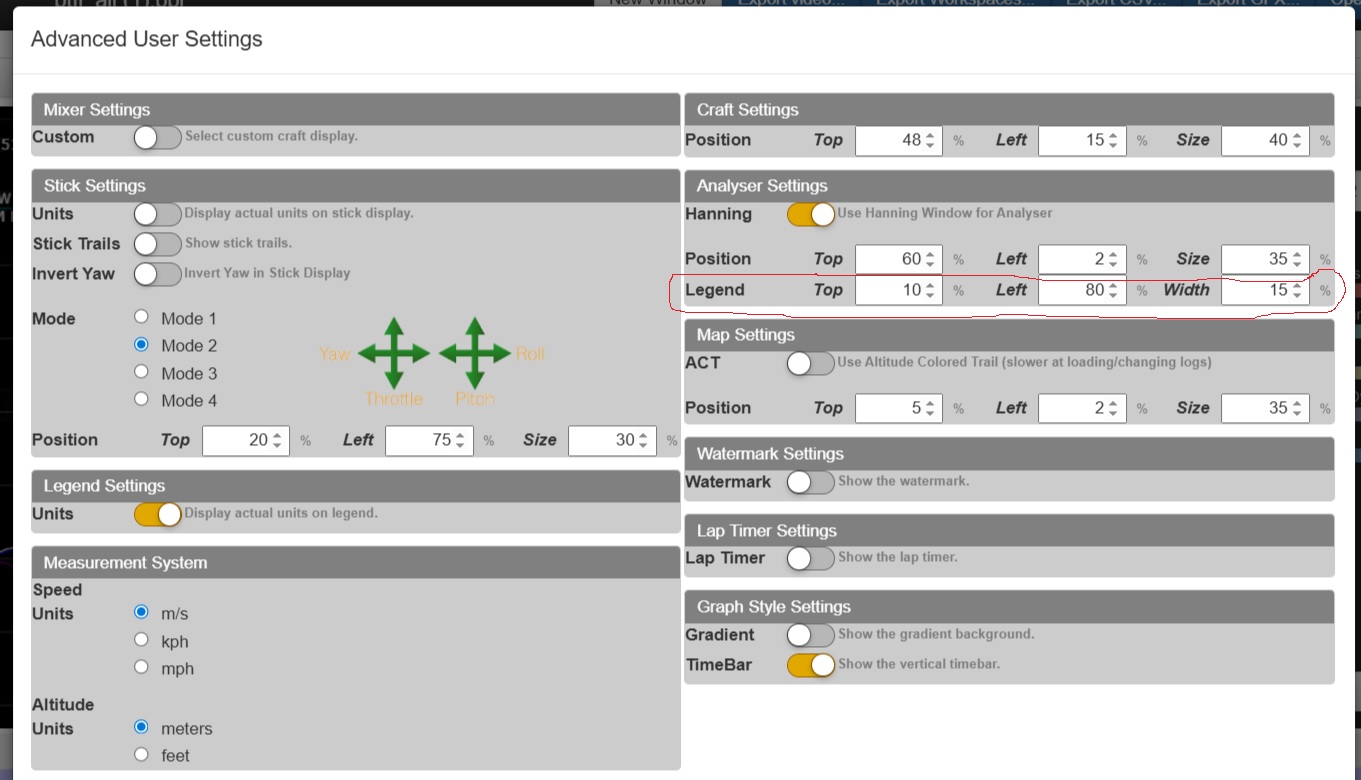
The legends width and position can set in User settings dialog box